
📷 Image: Wikimedia Commons / Ministry of Environment, Forest and Climate Change
Weather
Delhi’s AQI reported at 370, but some apps show 1,000 – reasons for the gap
✍️ The Indian Express
🗓 09 Nov 2026, 03:16 PM
👁 15
Delhi’s official air‑quality index stands at 370, yet several online platforms display a reading of 1,000. The disparity stems from differing calculation methods and data sources.
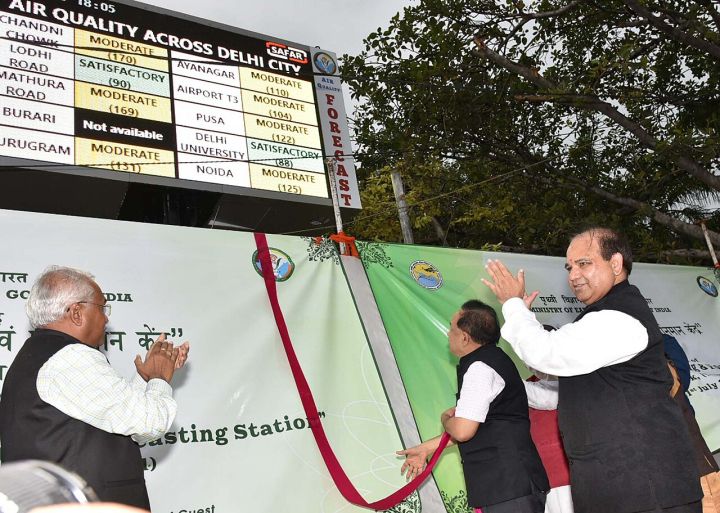
The National Air Quality Index (AQI) released by Delhi’s Pollution Control Board currently records a value of 370, placing the capital in the severe pollution bracket. However, a number of popular weather and health apps are showing the AQI at the maximum scale of 1,000, causing confusion among residents.
The variation arises because different platforms use distinct formulas to convert raw pollutant concentrations into a single AQI figure. While the government follows the Central Pollution Control Board’s (CPCB) standard, which averages the concentrations of PM2.5, PM10, NO2, SO2, CO and O3 over a 24‑hour period, many private apps adopt the U.S. EPA model or a proprietary scaling that caps the index at 1,000.
Sensor placement also influences the numbers. Official readings are taken from a network of fixed monitoring stations spread across Delhi, whereas some apps pull data from low‑cost sensors located in densely populated neighborhoods, where pollutant levels can be higher.
Additionally, the update frequency differs. Government data is refreshed hourly, while some commercial services update every few minutes, capturing short‑term spikes that push the index toward the upper limit.
Understanding these methodological differences helps the public interpret the numbers correctly and take appropriate health precautions during high‑pollution episodes.
The variation arises because different platforms use distinct formulas to convert raw pollutant concentrations into a single AQI figure. While the government follows the Central Pollution Control Board’s (CPCB) standard, which averages the concentrations of PM2.5, PM10, NO2, SO2, CO and O3 over a 24‑hour period, many private apps adopt the U.S. EPA model or a proprietary scaling that caps the index at 1,000.
Sensor placement also influences the numbers. Official readings are taken from a network of fixed monitoring stations spread across Delhi, whereas some apps pull data from low‑cost sensors located in densely populated neighborhoods, where pollutant levels can be higher.
Additionally, the update frequency differs. Government data is refreshed hourly, while some commercial services update every few minutes, capturing short‑term spikes that push the index toward the upper limit.
Understanding these methodological differences helps the public interpret the numbers correctly and take appropriate health precautions during high‑pollution episodes.